"use client";

import { useId, useState } from "react";
import { Area, ComposedChart, Line, ResponsiveContainer, Tooltip, XAxis, YAxis } from "recharts";

import { Chip } from "@/components/base/badges/chip";
import { useCountUp } from "@/hooks/use-count-up";
import { cx } from "@/utils/cx";

/**
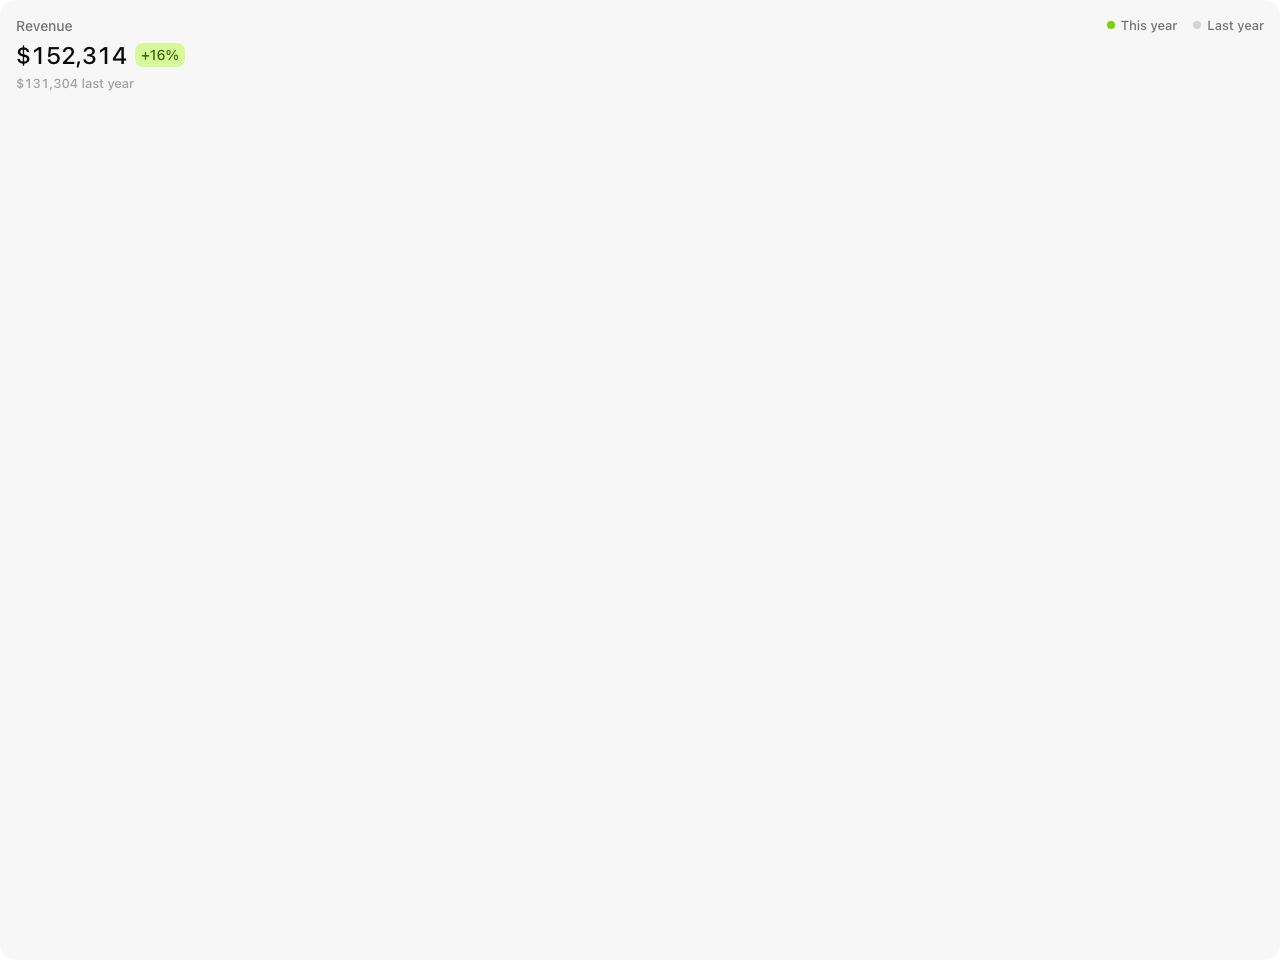
 * Revenue Chart Card: a year of monthly revenue drawn against the year before.
 *
 * The current year is the filled area and solid line, last year the dashed
 * line behind it, so the gap between them is the story. Hovering a month
 * swaps the headline for that month's figure and shows what it was a year
 * earlier. The frame, the count-up headline and the delta chip follow the
 * stat cards and the other chart cards, so it sits in any dashboard row.
 */

const MONTHS = ["Jan", "Feb", "Mar", "Apr", "May", "Jun", "Jul", "Aug", "Sep", "Oct", "Nov", "Dec"];
const MONTHS_FULL = [
  "January",
  "February",
  "March",
  "April",
  "May",
  "June",
  "July",
  "August",
  "September",
  "October",
  "November",
  "December",
];

export type RevenuePoint = {
  /** Short month label on the axis. */
  label: string;
  /** Revenue this year, in the card's currency. */
  current: number;
  /** Revenue for the same month a year earlier. */
  previous: number;
};

/** Twelve months that add up to the stat cards' total revenue. */
export const REVENUE_DATA: RevenuePoint[] = [
  { label: "Jan", current: 9840, previous: 8210 },
  { label: "Feb", current: 10120, previous: 8460 },
  { label: "Mar", current: 11380, previous: 9950 },
  { label: "Apr", current: 10960, previous: 10240 },
  { label: "May", current: 12210, previous: 10880 },
  { label: "Jun", current: 12740, previous: 11020 },
  { label: "Jul", current: 13980, previous: 11760 },
  { label: "Aug", current: 13120, previous: 12030 },
  { label: "Sep", current: 14210, previous: 12190 },
  { label: "Oct", current: 14690, previous: 12480 },
  { label: "Nov", current: 14360, previous: 12160 },
  { label: "Dec", current: 14703.92, previous: 11924 },
];

const formatK = (value: number) => (value >= 1000 ? `$${Math.round(value / 1000)}k` : `$${value}`);
const formatMoney = (value: number) =>
  value.toLocaleString("en-US", { minimumFractionDigits: 0, maximumFractionDigits: 0 });

function describeDelta(current: number, previous: number) {
  if (previous === 0) return { label: "New", color: "neutral" as const };
  const change = ((current - previous) / previous) * 100;
  const rounded = Math.round(change * 10) / 10;
  if (rounded === 0) return { label: "0%", color: "neutral" as const };
  return {
    label: `${rounded > 0 ? "+" : ""}${rounded}%`,
    color: rounded > 0 ? ("lime" as const) : ("rose" as const),
  };
}

/** The active month's marker on the current-year line. */
function ActiveDot({ cx: x, cy: y }: { cx?: number; cy?: number }) {
  if (x === undefined || y === undefined) return null;
  return (
    <g>
      <circle cx={x} cy={y} r={7} fill="var(--color-chart-2-active)" opacity={0.25} />
      <circle cx={x} cy={y} r={4} fill="var(--color-chart-2-active)" stroke="var(--color-background-secondary-default)" strokeWidth={2} />
    </g>
  );
}

export function RevenueChartCard({
  data = REVENUE_DATA,
  title = "Revenue",
  className,
}: {
  /** Twelve points, one per month; defaults to the demo year. */
  data?: RevenuePoint[];
  /** Headline label when no month is hovered. */
  title?: string;
  className?: string;
} = {}) {
  const [activeIndex, setActiveIndex] = useState<number | null>(null);
  const gradientId = useId();

  const totalCurrent = data.reduce((sum, point) => sum + point.current, 0);
  const totalPrevious = data.reduce((sum, point) => sum + point.previous, 0);
  const hovering = activeIndex !== null && activeIndex < data.length;
  const point = hovering ? data[activeIndex] : null;

  const headlineValue = point ? point.current : totalCurrent;
  const comparison = point ? point.previous : totalPrevious;
  const delta = describeDelta(headlineValue, comparison);
  const monthIndex = point ? MONTHS.indexOf(point.label) : -1;
  const label = point ? (monthIndex >= 0 ? MONTHS_FULL[monthIndex] : point.label) : title;
  const display = useCountUp(Math.round(headlineValue));

  const yMax = Math.max(...data.map((d) => Math.max(d.current, d.previous)));

  return (
    <section
      className={cx(
        "flex h-[344px] min-w-0 flex-1 flex-col gap-6 rounded-2xl bg-background-secondary-default px-4 pt-4 pb-3",
        className,
      )}
    >
      {/* Header: label over the count-up figure and its delta; legend on the right */}
      <div className="flex w-full flex-col gap-3 sm:flex-row sm:items-start sm:justify-between">
        <div className="flex min-w-0 flex-col gap-0.5">
          <p className="w-full text-body-medium text-text-secondary">{label}</p>
          <div className="flex w-full items-center gap-2">
            <p
              key={activeIndex ?? "total"}
              className="animate-number-fade text-title-1-medium whitespace-nowrap text-text-primary tabular-nums"
            >
              ${formatMoney(display)}
            </p>
            <Chip variant="bold" color={delta.color}>
              {delta.label}
            </Chip>
          </div>
          <p className="text-body-2-medium text-text-tertiary tabular-nums">
            ${formatMoney(comparison)} {point ? "a year earlier" : "last year"}
          </p>
        </div>
        <dl className="flex shrink-0 items-center gap-4 text-body-2-medium text-text-secondary">
          <div className="flex items-center gap-1.5">
            <span className="size-2 rounded-full bg-chart-2-active" aria-hidden />
            <dt>This year</dt>
          </div>
          <div className="flex items-center gap-1.5">
            <span className="size-2 rounded-full bg-chart-neutral" aria-hidden />
            <dt>Last year</dt>
          </div>
        </dl>
      </div>

      {/* Chart */}
      <div className="min-h-0 w-full flex-1">
        <ResponsiveContainer width="100%" height="100%">
          <ComposedChart
            data={data}
            margin={{ top: 4, right: 6, bottom: 0, left: 0 }}
            onMouseMove={(state) => {
              const index = Number(state?.activeTooltipIndex);
              if (state?.isTooltipActive && Number.isFinite(index)) setActiveIndex(index);
            }}
            onMouseLeave={() => setActiveIndex(null)}
          >
            <defs>
              <linearGradient id={gradientId} x1="0" y1="0" x2="0" y2="1">
                <stop offset="0%" stopColor="var(--color-chart-2)" stopOpacity={0.35} />
                <stop offset="100%" stopColor="var(--color-chart-2)" stopOpacity={0} />
              </linearGradient>
            </defs>
            <YAxis
              width={44}
              domain={[0, yMax * 1.1]}
              tickCount={4}
              tickFormatter={formatK}
              tickLine={false}
              axisLine={false}
              tick={{ fontSize: 12, fill: "var(--color-text-tertiary)" }}
            />
            <XAxis
              dataKey="label"
              tickLine={false}
              axisLine={false}
              tickMargin={12}
              interval="preserveStartEnd"
              tick={{ fontSize: 13, fill: "var(--color-text-tertiary)" }}
            />
            <Tooltip
              content={() => null}
              cursor={{ stroke: "var(--color-chart-cursor)", strokeWidth: 1, strokeDasharray: "4 4" }}
            />
            <Line
              type="monotone"
              dataKey="previous"
              stroke="var(--color-chart-neutral)"
              strokeWidth={2}
              strokeDasharray="5 5"
              dot={false}
              activeDot={false}
              isAnimationActive
              animationDuration={450}
            />
            <Area
              type="monotone"
              dataKey="current"
              stroke="none"
              fill={`url(#${gradientId})`}
              isAnimationActive
              animationDuration={450}
            />
            <Line
              type="monotone"
              dataKey="current"
              stroke="var(--color-chart-2-active)"
              strokeWidth={2.5}
              dot={false}
              activeDot={<ActiveDot />}
              isAnimationActive
              animationDuration={450}
            />
          </ComposedChart>
        </ResponsiveContainer>
      </div>
    </section>
  );
}