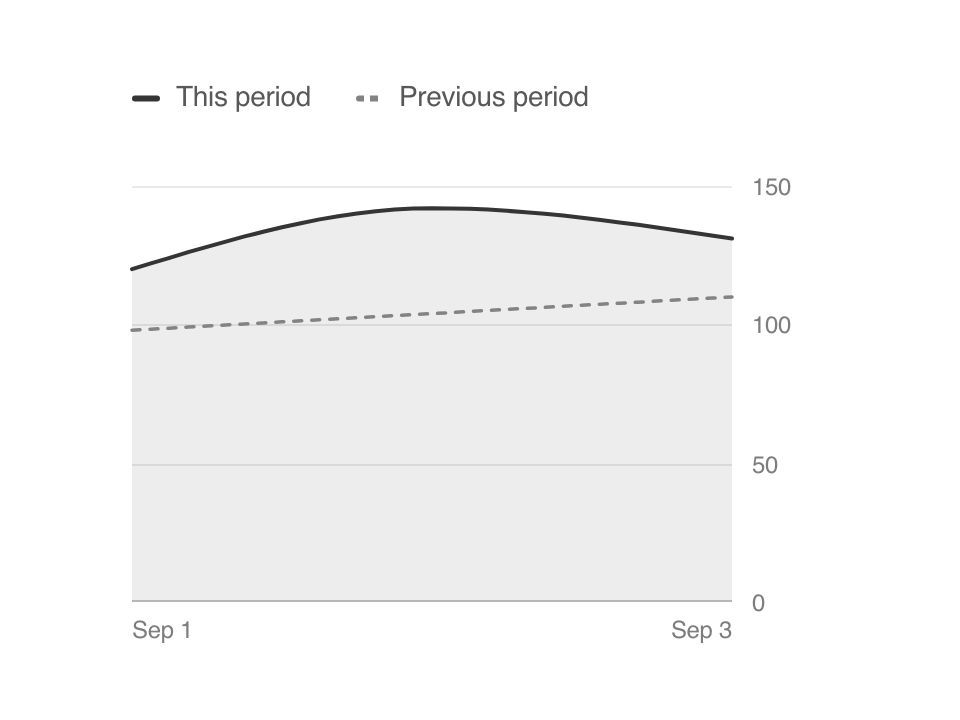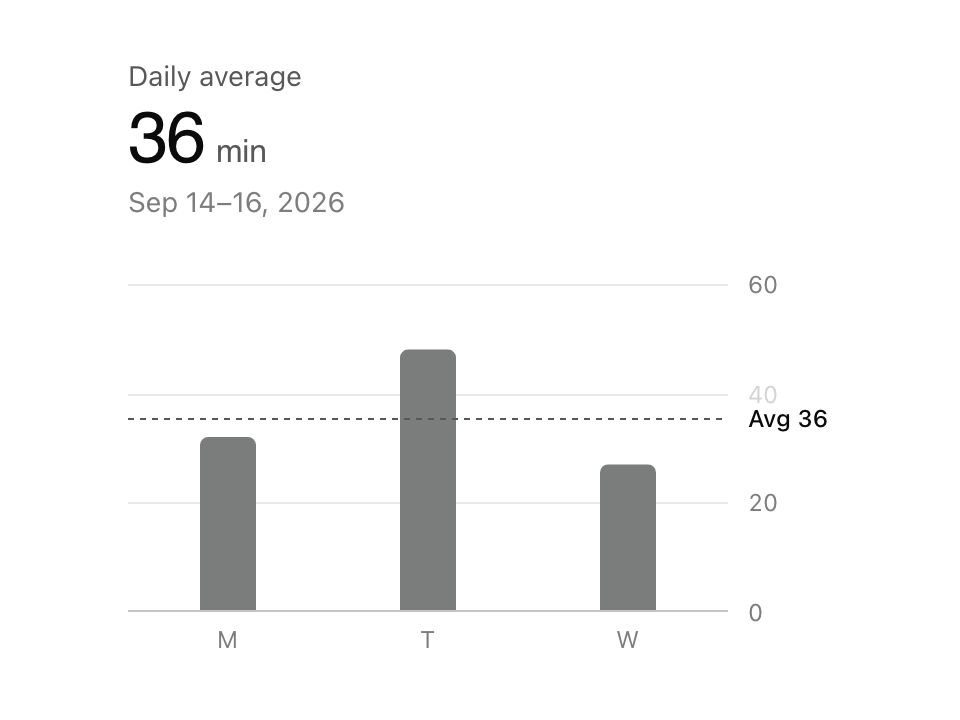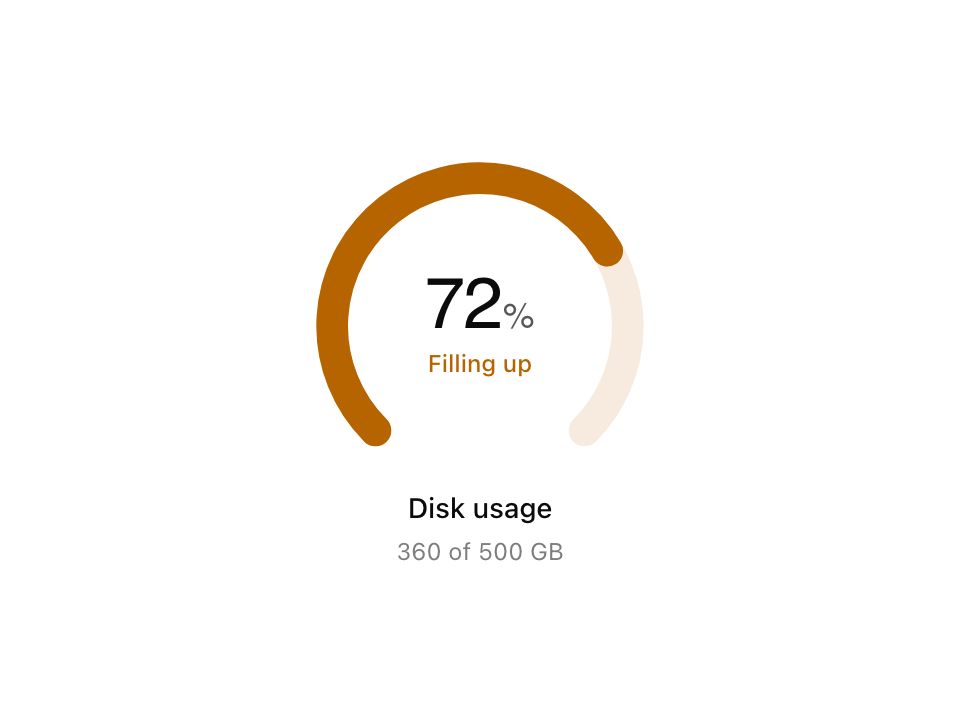
Live component. Click, hover, and type to try it.
Install
npx shadcn@latest add https://mdxcn.dev/r/graph-plot.jsonAbout
Line or area made of columns. Cap is █, fill is ░.
Live component. Click, hover, and type to try it.
npx shadcn@latest add https://mdxcn.dev/r/graph-plot.jsonLine or area made of columns. Cap is █, fill is ░.
"use client"

import type { ReactNode } from "react"
import { motion, useReducedMotion } from "motion/react"

import {
  Graph,
  GraphBody,
  GraphRule,
  numbers,
  seriesOf,
} from "@/registry/default/graph-frame/graph-frame"
import {
  clamp01,
  fillDelay,
  graphTransition,
  toneClass,
  trackMarks,
  type Glyphs,
  type GraphPalette,
} from "@/registry/default/graph-frame/graph-motion"
import { cn } from "@/lib/utils"

type GraphPlotProps = {
  title: string
  /** `[2, 3, 4]` or `"2 3 4"`. One value per column. Or write it as children. */
  data?: number[] | string
  labels?: string[]
  /** Markdown: `2 3 5 8`, or a list of `- Mon: 4` rows (labels kept). */
  children?: ReactNode
  height?: number
  variant?: "line" | "area"
  progress?: number
  glyphs?: Glyphs
  palette?: GraphPalette
  corner?: string
  className?: string
}

function formatTick(value: number) {
  if (Number.isInteger(value)) {
    return String(value)
  }

  return value.toFixed(1)
}

function GraphPlot({
  title,
  data: dataProp,
  labels: labelsProp,
  children,
  height = 7,
  variant = "area",
  progress = 1,
  glyphs,
  palette,
  corner,
  className,
}: GraphPlotProps) {
  const written = seriesOf(children)
  const data = dataProp == null ? written.data : numbers(dataProp)
  const labels =
    labelsProp ?? (written.labels.length > 0 ? written.labels : undefined)
  const reduce = useReducedMotion()
  const max = Math.max(...data, 0)
  const min = Math.min(0, ...data)
  const range = max - min || 1
  const end = labels?.[labels.length - 1]
  const start = labels?.[0]
  const yLabel = formatTick(max)
  const revealed = Math.round(clamp01(progress) * data.length)
  const lastLive = Math.max(0, revealed - 1)
  const marks = trackMarks(glyphs)

  return (
    <Graph title={title} className={className} corner={corner}>
      <GraphBody className="flex flex-col gap-3">
        <div className="flex gap-3">
          <div
            className="flex w-[4ch] shrink-0 flex-col justify-between py-px text-right text-graph-muted tabular-nums"
            style={{ height: `${height}em` }}
          >
            <span>{yLabel}</span>
            <span>{formatTick(min)}</span>
          </div>
          <div
            aria-hidden="true"
            className="flex min-w-0 flex-1 items-end select-none"
            style={{ height: `${height}em` }}
          >
            {data.map((value, column) => {
              const level = Math.round(((value - min) / range) * (height - 1))
              const live = column === lastLive && column < revealed
              const shown = column < revealed

              return (
                <span
                  className="flex h-full min-w-[1ch] flex-1 flex-col justify-end"
                  key={column}
                >
                  {Array.from({ length: height }, (_, row) => {
                    const fromBottom = height - 1 - row
                    const isCap = shown && fromBottom === level
                    const isFill =
                      shown && variant === "area" && fromBottom < level
                    const glyph = isCap ? marks.fill : isFill ? marks.rest : " "
                    const tone = isCap
                      ? live
                        ? toneClass(palette, "primary")
                        : "text-foreground"
                      : isFill
                        ? toneClass(palette, "secondary")
                        : "text-transparent"

                    return (
                      <motion.span
                        className={cn("h-[1em] w-full text-center", tone)}
                        initial={
                          reduce || !shown || glyph === " "
                            ? false
                            : { opacity: 0 }
                        }
                        key={row}
                        transition={graphTransition(reduce, {
                          delay: fillDelay(reduce, column),
                        })}
                        viewport={{ once: true }}
                        whileInView={{ opacity: 1 }}
                      >
                        {glyph}
                      </motion.span>
                    )
                  })}
                </span>
              )
            })}
          </div>
        </div>
        {start || end ? (
          <>
            <div className="flex gap-3">
              <span className="invisible w-[4ch] shrink-0 tabular-nums">
                {yLabel}
              </span>
              <GraphRule className="flex-1" />
            </div>
            <div className="flex gap-3">
              <span className="invisible w-[4ch] shrink-0 tabular-nums">
                {yLabel}
              </span>
              <div className="flex flex-1 justify-between text-graph-muted">
                <span>{start}</span>
                {end && end !== start ? <span>{end}</span> : null}
              </div>
            </div>
          </>
        ) : null}
        <span className="sr-only">
          {variant} plot, {data.length} points, min {formatTick(min)}, max{" "}
          {formatTick(max)}
        </span>
      </GraphBody>
    </Graph>
  )
}

export { GraphPlot }
export type { GraphPlotProps }