Stat CardsNew
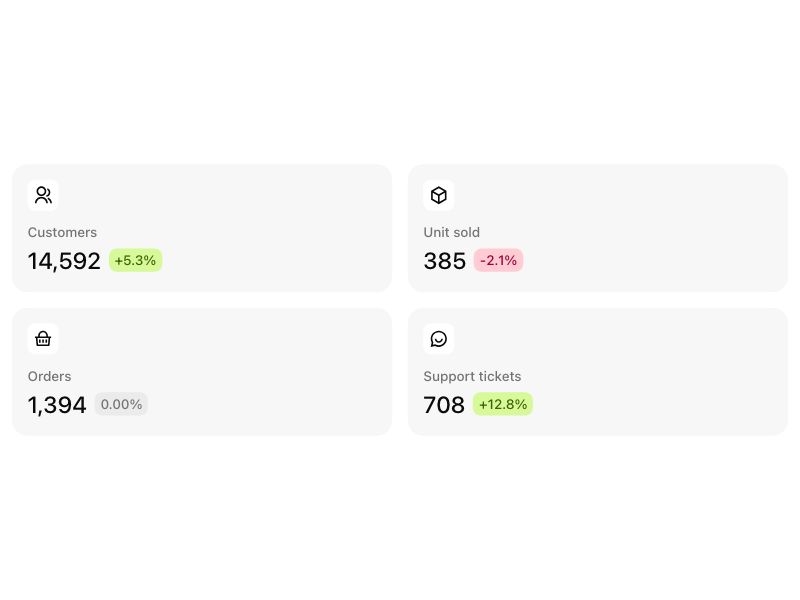
Live component. Click, hover, and type to try it.
Install
npx shadcn@latest add https://boardui.com/r/stat-cards.jsonAbout
KPI stat card row with delta chips.
Live component. Click, hover, and type to try it.
npx shadcn@latest add https://boardui.com/r/stat-cards.jsonKPI stat card row with delta chips.
"use client";

import { useTemplateCopy } from "@/components/foundations/template-copy/template-copy";

import { useState, type ComponentType } from "react";
import {
  RiArrowDownCircleFill,
  RiArrowUpCircleFill,
  RiBox3Line,
  RiChatSmile2Line,
  RiCoinsFill,
  RiGroupFill,
  RiGroupLine,
  RiIndeterminateCircleFill,
  RiInformationFill,
  RiRefund2Fill,
  RiShoppingBasket2Fill,
  RiShoppingBasketLine,
} from "@remixicon/react";
import { Focusable } from "react-aria-components";
import { Chip } from "@/components/base/badges/chip";
import { Tooltip, TooltipTrigger } from "@/components/base/tooltip/tooltip";
import { cx } from "@/utils/cx";

/**
 * Figma source: Board UI → dashboard 1 → Frame 20 (node 3731:3160) for the
 * plain cards; the footer variant follows the same inner-tile recipe as the
 * recent hires card.
 *
 * KPI stat cards in two looks:
 *
 *   plain   icon tile, label, value, delta chip — the compact dashboard row
 *   footer  tinted gradient icon tile beside the label (plus an optional
 *           info tooltip), a display-size value, and a white footer band
 *           carrying the comparison caption and a delta pill
 */

type IconComponent = ComponentType<{
  className?: string;
  "aria-hidden"?: boolean | "true" | "false";
}>;

export type StatCardsVariant = "plain" | "footer";

/** Tint of the footer variant's gradient icon tile. */
export type StatTone = "blue" | "orange" | "purple" | "pink" | "sky" | "emerald";

export type Stat = {
  icon: IconComponent;
  label: string;
  value: string;
  delta: string;
  deltaColor: "lime" | "rose" | "neutral";
  /** Footer variant: icon tile tint (defaults to blue). */
  tone?: StatTone;
  /** Footer variant: comparison caption in the band ("From last month"). */
  caption?: string;
  /** Footer variant: shows an info glyph with this text on hover. */
  hint?: string;
};

const DEFAULT_STATS: Stat[] = [
  { icon: RiGroupLine, label: "Customers", value: "14,592", delta: "+5.3%", deltaColor: "lime" },
  { icon: RiBox3Line, label: "Unit sold", value: "385", delta: "-2.1%", deltaColor: "rose" },
  { icon: RiShoppingBasketLine, label: "Orders", value: "1,394", delta: "0.00%", deltaColor: "neutral" },
  { icon: RiChatSmile2Line, label: "Support tickets", value: "708", delta: "+12.8%", deltaColor: "lime" },
];

const DEFAULT_FOOTER_STATS: Stat[] = [
  {
    icon: RiCoinsFill,
    label: "Total revenue",
    value: "$152,313.92",
    delta: "16%",
    deltaColor: "lime",
    tone: "blue",
    hint: "Gross revenue across every channel this month, before refunds. The change is against the same days last month.",
  },
  {
    icon: RiShoppingBasket2Fill,
    label: "Total orders",
    value: "25,162",
    delta: "20%",
    deltaColor: "lime",
    tone: "orange",
    hint: "Checkouts completed this month, repeat purchases included. The change is against the same days last month.",
  },
  {
    icon: RiGroupFill,
    label: "New customers",
    value: "3,847",
    delta: "8.1%",
    deltaColor: "lime",
    tone: "purple",
    hint: "People who bought for the first time this month. The change is against the same days last month.",
  },
  {
    icon: RiRefund2Fill,
    label: "Refunds",
    value: "$4,209.44",
    delta: "2.4%",
    deltaColor: "rose",
    tone: "pink",
    hint: "Value of orders refunded this month. Down is good here, so the change reads in red when refunds rise.",
  },
];

/** Gradient stops for the footer variant's icon tile, keyed by tone. */
const TILE_TONES: Record<StatTone, string> = {
  blue: "from-blue-500 to-blue-600",
  orange: "from-orange-400 to-orange-500",
  purple: "from-purple-500 to-purple-600",
  pink: "from-pink-500 to-pink-600",
  sky: "from-sky-400 to-sky-500",
  emerald: "from-emerald-500 to-emerald-600",
};

const DELTA_STYLES: Record<
  Stat["deltaColor"],
  { icon: IconComponent; className: string; pill: string }
> = {
  lime: {
    icon: RiArrowUpCircleFill,
    className: "text-status-lime-text",
    pill: "bg-status-lime-background",
  },
  rose: {
    icon: RiArrowDownCircleFill,
    className: "text-status-rose-text",
    pill: "bg-status-rose-background",
  },
  neutral: {
    icon: RiIndeterminateCircleFill,
    className: "text-text-secondary",
    pill: "bg-background-secondary-default",
  },
};

/** Tinted pill with a direction glyph — the footer band's delta readout, in
 *  the same lime and rose the chart cards use for their trend chips. */
function DeltaPill({ delta, deltaColor }: Pick<Stat, "delta" | "deltaColor">) {
  const localize = useTemplateCopy();
  const { icon: Icon, className, pill } = DELTA_STYLES[deltaColor];
  return localize((
    <span
      className={cx(
        "flex shrink-0 items-center gap-1 rounded-full py-0.5 pe-2 ps-1",
        pill,
      )}
    >
      <Icon className={cx("size-4 shrink-0", className)} aria-hidden />
      <span className={cx("text-body-medium whitespace-nowrap tabular-nums", className)}>
        {delta}
      </span>
    </span>
  ));
}

/** Bare info glyph with a tooltip — the footer header's trailing control.
 *  Opens on hover and focus as tooltips do, and on click as well, since a
 *  glyph this small reads as a button and gets tapped. */
function StatHint({ label, hint }: { label: string; hint: string }) {
  const localize = useTemplateCopy();
  const [open, setOpen] = useState(false);
  return localize((
    <TooltipTrigger delay={200} isOpen={open} onOpenChange={setOpen}>
      <Focusable>
        <button
          type="button"
          aria-label={`About ${label}`}
          onClick={() => setOpen((isOpen) => !isOpen)}
          className="flex shrink-0 cursor-pointer items-center justify-center rounded-full text-foreground-icon-secondary outline-none transition-colors duration-150 ease hover:text-foreground-icon-primary focus-visible:ring-2 focus-visible:ring-border-focus-ring"
        >
          <RiInformationFill className="size-5" aria-hidden />
        </button>
      </Focusable>
      <Tooltip size="md">{hint}</Tooltip>
    </TooltipTrigger>
  ));
}

function PlainStatCard({ stat }: { stat: Stat }) {
  const localize = useTemplateCopy();
  return localize((
    <section className="flex h-[132px] min-w-0 flex-col items-start justify-between rounded-2xl bg-background-secondary-default p-4">
      <span className="flex items-center rounded-md bg-stat-card-icon-background p-1.5">
        <stat.icon className="size-5 shrink-0 text-foreground-icon-primary" aria-hidden />
      </span>
      <div className="flex w-full flex-col gap-0.5">
        <p className="w-full text-body-medium text-text-secondary">{stat.label}</p>
        <div className="flex w-full flex-wrap items-center gap-2">
          <p className="text-title-1-medium whitespace-nowrap text-text-primary">{stat.value}</p>
          <Chip variant="bold" color={stat.deltaColor}>
            {stat.delta}
          </Chip>
        </div>
      </div>
    </section>
  ));
}

function FooterStatCard({ stat }: { stat: Stat }) {
  const localize = useTemplateCopy();
  return localize((
    <section className="flex min-w-0 flex-col rounded-2xl bg-background-secondary-default p-2">
      {/* Icon tile + optional info glyph, both hanging from the same top inset */}
      <div className="flex w-full items-start justify-between gap-2.5 p-2">
        <span
          className={cx(
            "flex size-10 shrink-0 items-center justify-center rounded-2lg bg-linear-to-b",
            TILE_TONES[stat.tone ?? "blue"],
          )}
        >
          <stat.icon className="size-5 shrink-0 text-white" aria-hidden />
        </span>
        {stat.hint && <StatHint label={stat.label} hint={stat.hint} />}
      </div>

      {/* Label sits directly over the number, as on the plain cards */}
      <div className="flex flex-col gap-0.5 px-2 pt-2.5 pb-3.5">
        <p className="truncate text-body-medium text-text-secondary">{stat.label}</p>
        <p className="text-display-4-medium whitespace-nowrap text-text-primary tabular-nums">
          {stat.value}
        </p>
      </div>

      {/* Footer band: comparison caption + delta pill on an inner tile */}
      <div className="mt-auto flex w-full items-center justify-between gap-2 rounded-2lg bg-background-inner-default py-1.5 pe-1.5 ps-2.5 shadow-card">
        <p className="truncate text-body-regular text-text-secondary">
          {stat.caption ?? "From last month"}
        </p>
        <DeltaPill delta={stat.delta} deltaColor={stat.deltaColor} />
      </div>
    </section>
  ));
}

export function StatCards({
  variant = "plain",
  stats,
  count,
  columns = 4,
  className,
}: {
  variant?: StatCardsVariant;
  /** KPI cards to render; defaults to demo metrics matching the variant. */
  stats?: Stat[];
  /** How many KPI cards to render (from the start of the list). */
  count?: number;
  /** Columns at the widest breakpoint - 2 keeps the grid two-up for
   *  narrower hosts (docs previews, split layouts), 1 pins a single
   *  column at every width. */
  columns?: 1 | 2 | 4;
  className?: string;
} = {}) {
  const localize = useTemplateCopy();
  const items =
    stats ?? (variant === "footer" ? DEFAULT_FOOTER_STATS : DEFAULT_STATS);
  return localize((
    <div
      className={cx(
        "grid w-full gap-4",
        // The footer cards carry a display-size value, so they go one per
        // row on phones where the plain cards still fit two up.
        columns === 1
          ? "grid-cols-1"
          : variant === "footer"
            ? "grid-cols-1 sm:grid-cols-2"
            : "grid-cols-2",
        columns === 4 && (variant === "footer" ? "xl:grid-cols-4" : "lg:grid-cols-4"),
        className,
      )}
    >
      {items.slice(0, count ?? items.length).map((stat) =>
        variant === "footer" ? (
          <FooterStatCard key={stat.label} stat={stat} />
        ) : (
          <PlainStatCard key={stat.label} stat={stat} />
        ),
      )}
    </div>
  ));
}